The Visual Navigator: The Intuitive Thinker Who Needs a Clear Financial Picture

TL;DR for Visual Navigators:
✔ Use graph-based tracking tools to make financial trends clear.
✔ Set up a color-coded budgeting system for intuitive money management.
✔ Track financial goals with visual milestones to maintain motivation.
✔ Avoid text-heavy financial statements and use summary-based dashboards instead. If you do need to process raw financial data, consider highlighting key numbers (such as total balance, due dates, or spending trends) or using a tool that auto-summarizes your statements. For example, instead of digging through long, text-heavy credit card statements, opt for a dashboard that visually breaks down spending by category with color-coded sections and graphs.
Do numbers and spreadsheets overwhelm you, but graphs, symbols, and intuitive layouts make financial management easier?
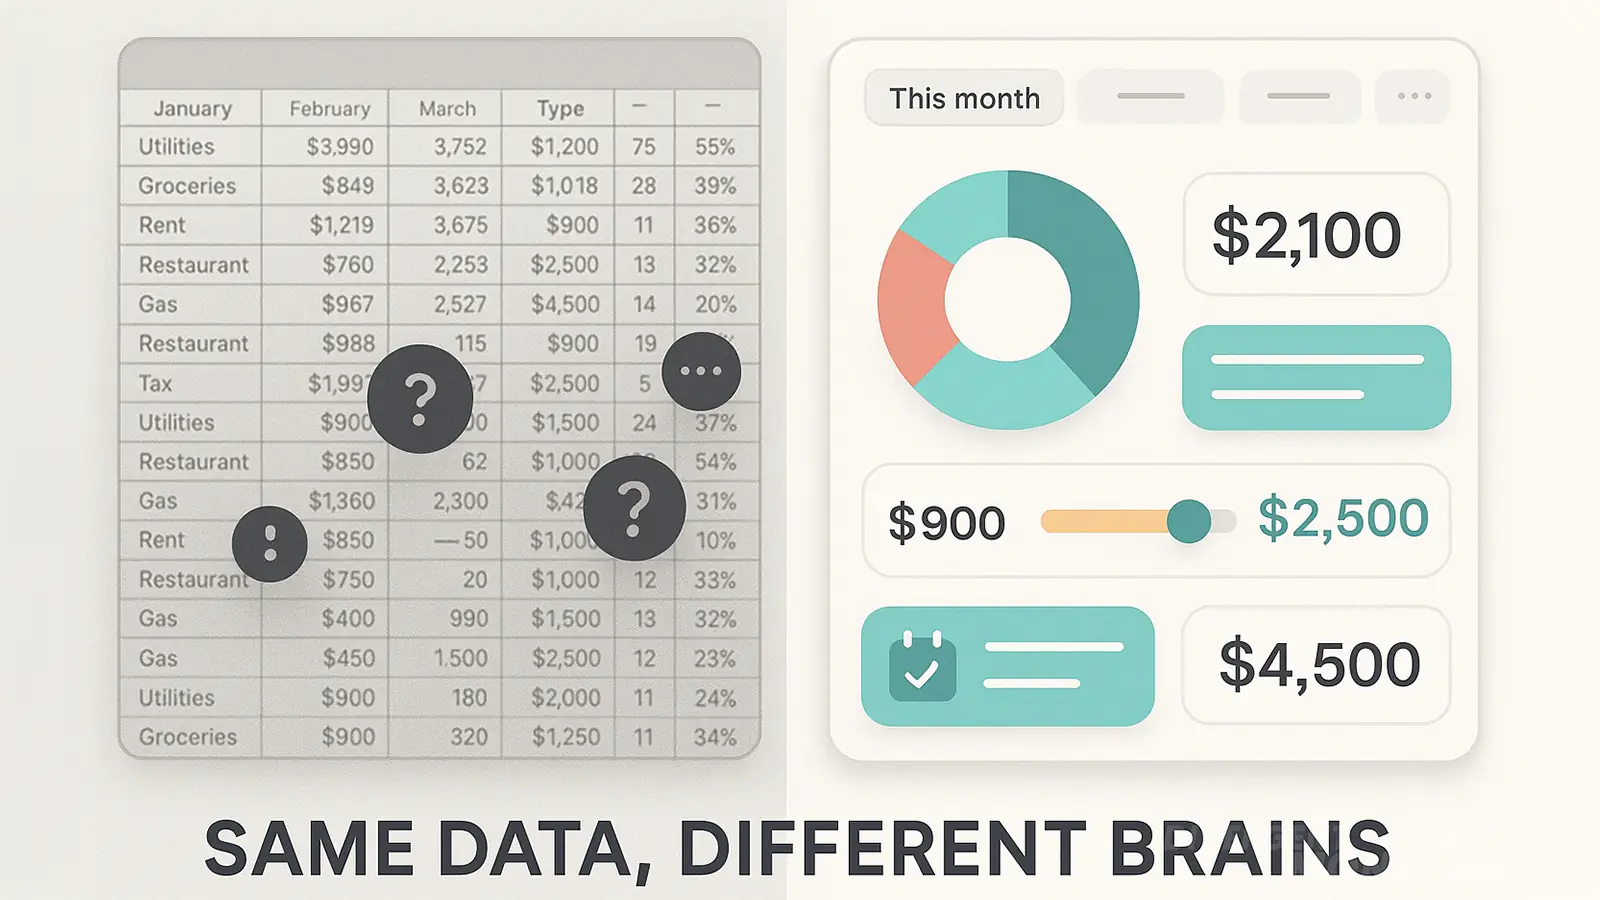
You open a spreadsheet. Rows of numbers stare back. Five minutes in, your brain fogs over. But then you see a pie chart—and suddenly it all makes sense. If you’ve ever felt that instant click from seeing your finances instead of reading them, you might be a Visual Navigator.
Visual Navigators process financial information spatially and intuitively. They’re drawn to dashboards, graphs, and tools that turn data into storylines. Give them raw numbers, and they freeze. Give them a color-coded chart? They’re in.
What Is a Visual Navigator?
Visual Navigators thrive when they can see how their money moves—literally. They are:
- Pattern-driven
- Emotionally responsive to layout and clarity
- Motivated by intuitive, visual systems
They can excel at money management when supported by the right tools—but may struggle when forced into traditional, text-heavy, or number-dense systems.
✅ Strengths of a Visual Navigator
- Quick pattern recognition in spending or saving trends
- High engagement with visuals like pie charts, sliders, and trackers
- Faster decision-making when information is laid out clearly
- Less stress with financial tools that reduce cognitive load
❌ Biggest Challenges
- Avoiding number-heavy financial tasks
- Overwhelm from spreadsheets or financial jargon
- Disengagement when systems feel cold, cluttered, or illogical
- Difficulty with long-term planning if not reinforced visually

How Neurotypes Influence Visual Navigators
Many Visual Navigators identify as neurodivergent—though not always.
- Dyslexic individuals often process information spatially, not sequentially. Some struggle with number-dense formats, but excel when financial data is presented visually.
- ADHD brains rely on visual memory and pattern cues. Dashboards, icons, and feedback loops work better than endless rows of transactions.
- Autistic thinkers may crave system clarity and visual order, but can also get overstimulated if design is too chaotic.
✨ Visual Navigation is not a weakness—it’s a style. One that deserves well-designed tools.
Why Visual Systems Work (Especially for ND Brains) 🧠
Traditional budgeting creates friction: delayed rewards, lots of abstraction, low dopamine.
Visual tools reduce cognitive load, build momentum, and create positive feedback loops. For neurodivergent brains that thrive on clarity, seeing progress is often more powerful than calculating it.
The Best Money Strategy for Visual Navigators
Your financial system should be designed around clarity—not complexity.
1. Use Graph-Based Financial Tracking Tools
Why this works: Trends are easier to spot visually than numerically.
How to try it: Use apps like:
- Monarch Money – Beautiful dashboards and trend charts
- PocketGuard – Color-coded spending breakdowns
- Emma – Simplifies spending into digestible visuals
2. Set Up a Color-Coded Budget
Why this works: Reinforces memory through color cues.
How to try it: Use Mint, YNAB, or even analog color sticker systems. Assign red to debt, green to income, yellow to fun spending, etc.
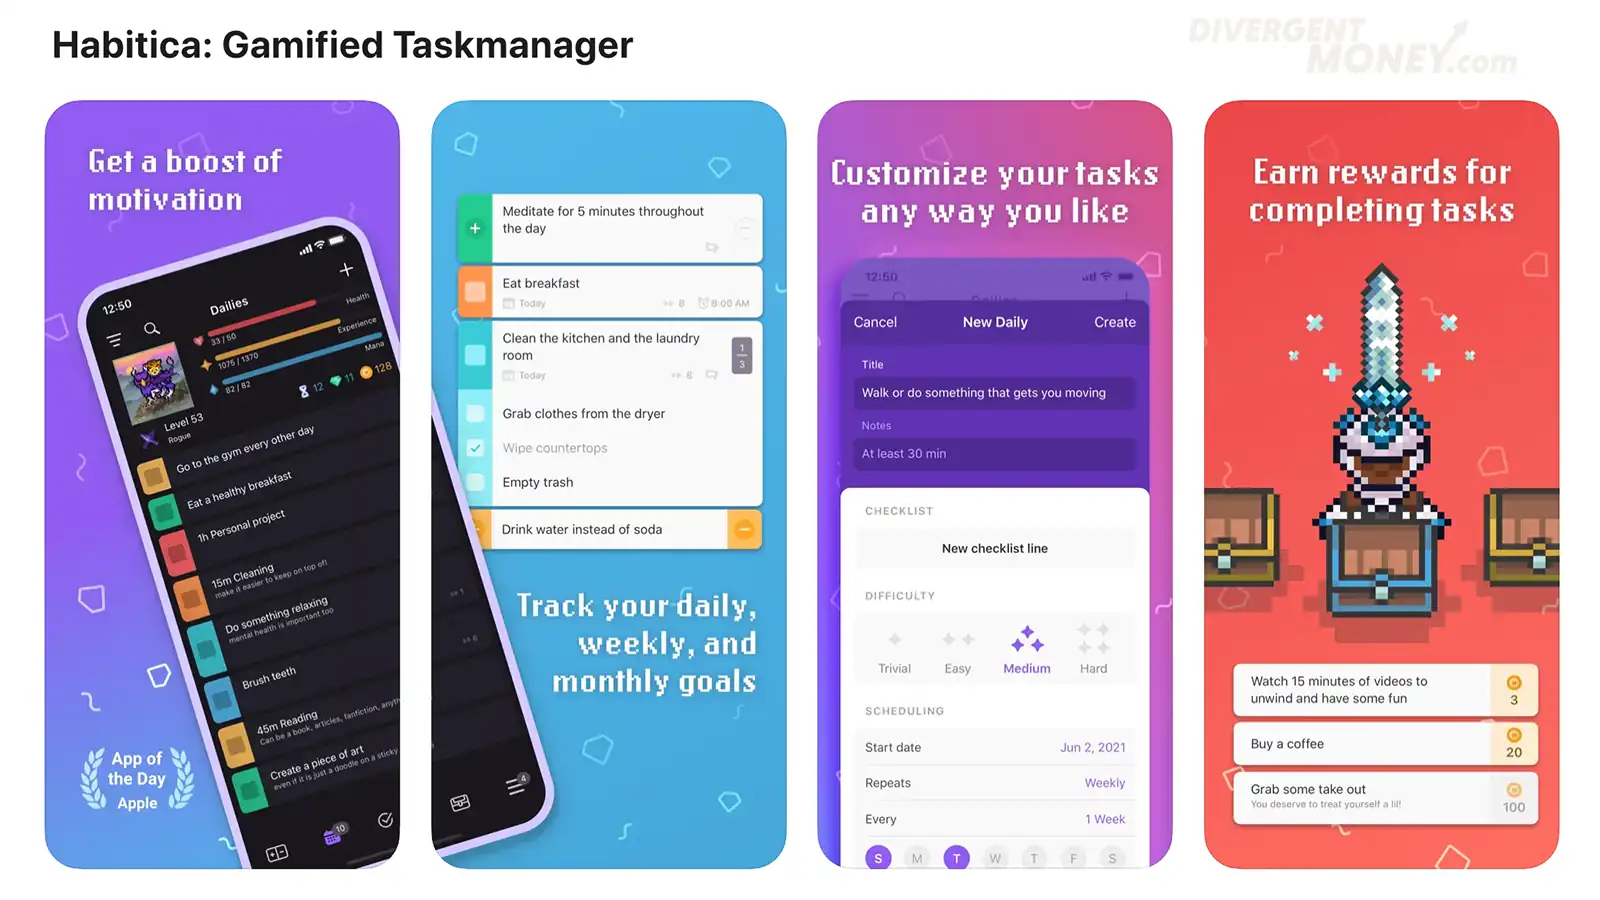
3. Turn Financial Goals into Visual Milestones
Why this works: Visual gamification = sustained motivation.
How to try it:
- Create printable goal trackers with progress bars.
- Use vision boards with money milestones.
- Design a "level-up" chart (e.g. Debt Boss → Budget Ninja → Investing Wizard).
4. Minimize Text-Heavy Financial Statements
Why this works: Less clutter = less disengagement.
How to try it: Use tools that summarize key insights visually. Ask your bank or advisor for dashboards instead of spreadsheets.
Best Tools for Visual Navigators
💡 Monarch Money – Uses intuitive visual dashboards for budgeting.
💡 PocketGuard – Color-coded tracking with projected cash flow views.
💡 YNAB – Fully customizable categories with optional visual tags.
💡 Emma – Graphs, trends, and smart visual nudges to improve spending habits.
FAQ: Visual Navigators & Money
What is visual budgeting?
Managing money through graphs, charts, icons, and visual frameworks instead of raw numbers or text.
How do I know if I’m a visual navigator?
If you feel relief when data is presented in charts—and anxiety when it’s in tables—you probably are.
What if visuals overwhelm me?
Stick to low-stimulation interfaces with high-contrast designs. Choose one dashboard view and hide clutter.
Is this style just for neurodivergent people?
Nope. But it can be life-changing for ADHD, dyslexic, or autistic thinkers who process the world visually.
What’s Next?
If this sounds like you, check out The Divergent Money Matrix to explore different financial mindsets.
Disclaimer: As ALWAYS, this article is for educational and motivational purposes and is not financial advice. Always consider consulting with a financial professional for guidance tailored to your unique situation.